Answer & Solution
Answer: Option C
Solution:
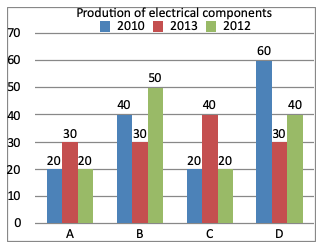
$$\eqalign{
& \text{A} = \frac{20 + 30 + 20}{3} \cr
& \,\,\,\,\, = \frac{70}{3} \cr
& \,\,\,\,\, = 23.33 \cr
& \cr
& \text{B} = \frac{40 + 30 + 50}{3} \cr
& \,\,\,\,\, = \frac{120}{3} \cr
& \,\,\,\,\, = 40 \cr
& \cr
& \text{C} = \frac{20 + 20 + 40}{3} \cr
& \,\,\,\,\, = \frac{80}{3} \cr
& \,\,\,\,\, = 26.66 \cr
& \cr
& \text{D} = \frac{60 + 30 + 40}{3} \cr
& \,\,\,\,\, = \frac{130}{3} \cr
& \,\,\,\,\, = 43.33 \cr} $$
So company D has the highest production.
