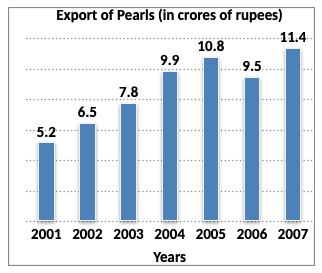
Solution:
$$\eqalign{
& \text{Increase % in various years} \cr
& 2002 → \left\{\frac{\left(6.5-5.2\right)}{5.2}\times100\right\}\% \cr
& \,\,\,\,\,\,\,\,\,\,\,\,\, = \left(\frac{1.3}{5.2}\times100\right)\% \cr
& \,\,\,\,\,\,\,\,\,\,\,\,\, = \left(\frac{13}{52}\times100\right)\% \cr
& \,\,\,\,\,\,\,\,\,\,\,\,\, = 25\% \cr
\cr
& 2003 → \left\{\frac{\left(7.8-6.5\right)}{6.5}\times100\right\}\% \cr
& \,\,\,\,\,\,\,\,\,\,\,\,\, = \left(\frac{1.3}{6.5}\times100\right)\% \cr
& \,\,\,\,\,\,\,\,\,\,\,\,\, = \left(\frac{13}{65}\times100\right)\% \cr
& \,\,\,\,\,\,\,\,\,\,\,\,\, = 20\% \cr
\cr
& 2004 → \left\{\frac{\left(9.9-7.8\right)}{7.8}\times100\right\}\% \cr
& \,\,\,\,\,\,\,\,\,\,\,\,\, = \left(\frac{2.1}{7.8}\times100\right)\% \cr
& \,\,\,\,\,\,\,\,\,\,\,\,\, = \left(\frac{21}{78}\times100\right)\% \cr
& \,\,\,\,\,\,\,\,\,\,\,\,\, = 26.9\% \cr
\cr
& 2005 → \left\{\frac{\left(10.8-9.9\right)}{9.9}\times100\right\}\% \cr
& \,\,\,\,\,\,\,\,\,\,\,\,\, = \left(\frac{0.9}{9.9}\times100\right)\% \cr
& \,\,\,\,\,\,\,\,\,\,\,\,\, = \left(\frac{9}{99}\times100\right)\% \cr
& \,\,\,\,\,\,\,\,\,\,\,\,\, = \frac{100}{11}\% \cr
& \,\,\,\,\,\,\,\,\,\,\,\,\, = 9.090\% \cr
\cr
& 2007 → \left\{\frac{\left(11.4-9.5\right)}{9.5}\times100\right\}\% \cr
& \,\,\,\,\,\,\,\,\,\,\,\,\, = \left(\frac{1.9}{9.5}\times100\right)\% \cr
& \,\,\,\,\,\,\,\,\,\,\,\,\, = \left(\frac{19}{95}\times100\right)\% \cr
& \,\,\,\,\,\,\,\,\,\,\,\,\, = 20\% \cr
& \cr } $$
Clearly, the maximum increase was in 2004
