Answer & Solution
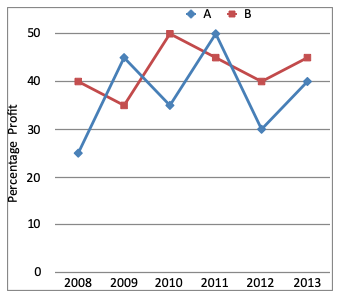
Profit percent earned by company B in 2010 = 50%
Expenditure of company B in 2009 = 12 lakhs
Expenditure of company B in 2010 = 14.5 lakhs
Income of company B in 2009
$$\eqalign{ & 35\% = \frac{I - E}{E}\times100 \cr & \Rightarrow 35 = \frac{I - 12\text{ lakh}}{12\text{ lakh}}\times100 \cr & \Rightarrow \left(35\times12\right)\text{lakh} = 100I-1200\text{ lakh} \cr & \Rightarrow 420\text{ lakh} = 100I - 1200 \text{ lakh} \cr & \Rightarrow I = 16.20 \text{ lakh} \cr & \text{Income of company B in 2009} \cr & 50\% = \frac{I - E}{E}\times100 \cr & \Rightarrow 50 = \frac{I - 14.5\text{ lakh}}{14.5\text{ lakh}}\times100 \cr & \Rightarrow \left(50\times14.5\right)\text{lakh} = 100I-14.50\text{ lakh} \cr & \Rightarrow 2175\text{ lakh} = 100I \text{ lakh} \cr & \Rightarrow I = 21.75 \text{ lakh} \cr} $$
So,
Total income of company B in 2009 and 2010
= 16.2 + 21.75
= Rs. 37.95 lakhs

