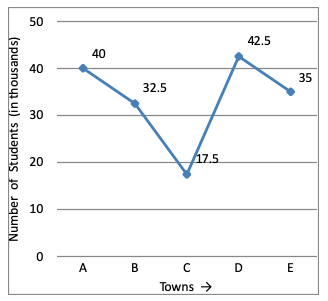
Directions (1 - 5): Study the following line graph carefully and answer the questions given below:
Number of Students Appearing For Aptitude Test From Various Town (In Thousands).
direction image of Line Chart chapter

1.
The number of students appearing for the Aptitude Test from Town E is approximately what percent of the total number of students appearing for the Aptitude Test from all the towns together?

2.
What is the ratio of the number of students appearing for the Aptitude Test from Town B to that from Town A?

3.
What is the ratio of the number of students appearing for the Aptitude Test from Towns C and D together to the number of students appearing for the Aptitude Test from Towns A, D and E together?

4.
What is the average number of students appearing for the Aptitude Test from all the towns together?

5.
The number of students appearing for the Aptitude Test from Town D is approximately what percentage of the number of students appearing for the Aptitude Test from Town C?