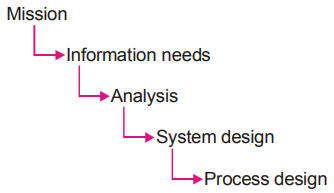
31. Given

The above diagram expressed, which model of system?

The above diagram expressed, which model of system?
32. Size of the binomial distribution depends on
33. 160 heads and 240 tails resulted from 400 tosses of a coin. Find a 95% confidence interval for the probability of a head. Does this appear to be a fair coin?
[Hint p = $$\frac{1}{2}$$, q = $$\frac{1}{2}$$, n = 400
Expected frequency = np = 200
Standard error = $$\sqrt {npq} $$ = 10
Actual difference = 200 - 160 = 40
Difference is greater than 3 times standard error coin is unfair.]
[Hint p = $$\frac{1}{2}$$, q = $$\frac{1}{2}$$, n = 400
Expected frequency = np = 200
Standard error = $$\sqrt {npq} $$ = 10
Actual difference = 200 - 160 = 40
Difference is greater than 3 times standard error coin is unfair.]
34. Networks are used for
35. Match the items of List II with the items of List I and denote the correct matching.
List-I
List-II
a. Testing the goodness of fit of a distribution
1. Z-test
b. Testing the significance of the differences among the average performance of more than two sample groups
2. Chi-square test
c. Testing the significance of the difference between the average performance of two sample groups (large sired)
3. F-test
| List-I | List-II |
| a. Testing the goodness of fit of a distribution | 1. Z-test |
| b. Testing the significance of the differences among the average performance of more than two sample groups | 2. Chi-square test |
| c. Testing the significance of the difference between the average performance of two sample groups (large sired) | 3. F-test |
36. If covariance of X and Y is 12.3. Variance of X is 16.4 and variance of Y is 13.8, then r will be
$$\left[ {{\bf{Hint:}}{\text{r}} = \frac{{{\text{Covariance x, y}}}}{{\sqrt {\left( {{\text{Variance of X}}} \right) \times \left( {{\text{Variance of Y}}} \right)} }}} \right]$$
$$\left[ {{\bf{Hint:}}{\text{r}} = \frac{{{\text{Covariance x, y}}}}{{\sqrt {\left( {{\text{Variance of X}}} \right) \times \left( {{\text{Variance of Y}}} \right)} }}} \right]$$
37. Which system is defined as a product made up of several applications set in orderly manner to produce a higher level information output different than the output of the application processing
38. "The concept of a control system model is applied to data processing where all the features are used in the programmes of the data processing." This system is a
39. Binomial distribution is a discrete probability distribution which expresses probability of one set of dichotomous alternatives known as
40. The standard deviation of poisson distribution is (m = mean)
Read More Section(Business Statistics)
Each Section contains maximum 100 MCQs question on Business Statistics. To get more questions visit other sections.
