
ExamVeda
Login
Home
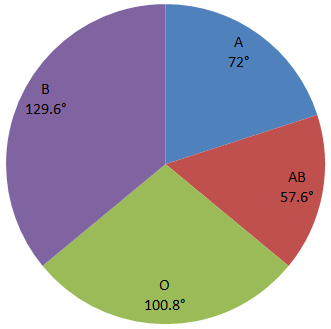
Directions (1 - 4): This is a pie chart for the data on A, B, O, AB blood groups of 150 donors. Observe the pie chart and answer the questions.
Direction image of Pie Chart chapter
1
The ratio of donors blood group ‘A’ to the average of the donors group ‘O’, ‘B’ and ‘AB’ is:
Discuss
Answer & Solution
Average of O, B, AB blood group
$$\eqalign{ & = \frac{100.8° + 129.6° + 57.6°}{3} \cr & = \frac{288°}{3} \cr & = 96° \cr & \therefore \text{Required ratio} \cr & = 72° : 96° \cr & = 3 : 4 \cr} $$
2
The number of persons having either blood group ‘A’ or blood group ‘B’ is:
Discuss
Answer & Solution
Person having blood group A or B
$$\eqalign{ & = \frac{129.6° + 72°}{360}\times150 \cr & = 84 \cr} $$
3
The number of donors having group ‘O’ is:
Discuss
Answer & Solution
The number of donor having group O
$$\eqalign{ & = \frac{100.8°}{360}\times150 \cr & = 42 \cr} $$
4
What is the percentage of donors having blood group ‘AB’ ?
Discuss
Answer & Solution
% of person having blood group AB
$$\eqalign{ & = \frac{57.6°}{360°}\times 100 \cr & = 16\% \cr} $$