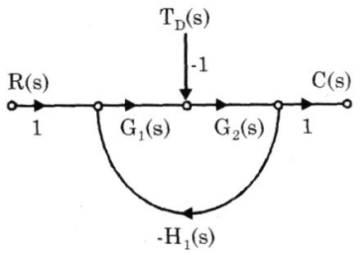
The signal flow graph of a closed-loop system is shown in the figure, where TD represents the disturbance in the forward path: The effect of the disturbance can be reduced by:

A. Increasing G2(s)
B. Decreasing G2(s)
C. Increasing G1(s)
D. Decreasing G1(s)
Answer: Option C
Related Questions on Control Systems
In root locus analysis the breakaway and break in points
A. lie on the real axis
B. Either lie on the real axis or occur in complex conjugate pairs
C. Always occur in complex conjugate pairs
D. None of the above
Which of the following features is not associated with Nichols chart?
A. (0 dB, -180°) point on Nichols chart represent critical Point (-1, 0)
B. It is symmetric about -180°
C. M loci are centred about (0 dB, -180°) point
D. The frequency at intersection of G (j$$\omega $$) locus and M = +3 dB locus gives bandwidth of closed loop system

Join The Discussion