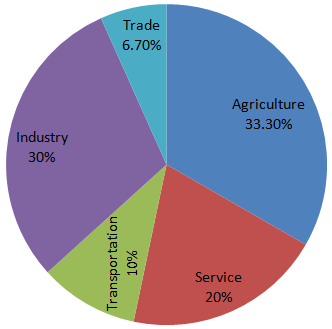
Direction (1 - 4): Study the pie- chart carefully and answer the questions. The pie- chart represents the percentage of people involved in various occupations.
Total number of people = 20000.

The difference between the maximum number of people involved and minimum number of people involved in various professions is:
A. 264
B. 364
C. 632
D. 5320
Answer: Option D
Solution(By Examveda Team)
Maximum people in any profession - Minimum people involved in any professionAgriculture = 33.30%
Trade = Minimum = 6.70%
Difference = 33.30% - 6.70% = 26.60%
100% = 20000
1% = 200
26.6% = 200 × 26.6
= 5320
Related Questions on Pie Chart
The annual savings in the form of provident fund would be:
A. Rs. 48456
B. Rs. 48540
C. Rs. 44856
D. Rs. 45480
A. Rs. 23545
B. Rs. 24435
C. Rs. 23555
D. Rs. 25355
The total amount per month, the family spends on food and entertainment combined together, is:
A. Rs. 11432
B. Rs. 11441
C. Rs. 12315
D. Rs. 12443

Join The Discussion