
ExamVeda
Login
Home
This question belongs to Data Interpretation Pie Chart
Read the following information
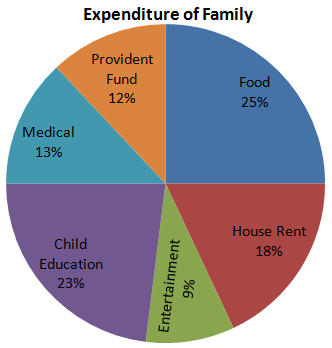
Directions (1 - 4): Study the chart and answer the questions: The pie chart given here represents the domestic expenditure of a family in percent. Study the chart and answer the following questions if the total monthly income of the family is Rs. 33,650

Direction image of Pie Chart chapter
Pie Chart
?

The total amount per month, the family spends on food and entertainment combined together, is:

Answer & Solution
Correct Answer: Option B
Spent on food and entertainment
= 34% of Rs. 33650
= $$\frac{34\times33650}{100}$$
= Rs. 11441
Examveda
Question posted by Examveda
Community

Join the Discussion

No comments yet Be the first to discuss this question.