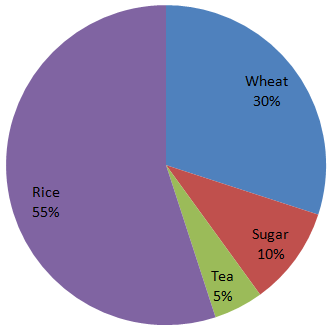
Directions (1 - 4): In the given pie- chart , the comparative study of the production of rice, wheat, sugar and tea of a country is given. Study the pie- chart and answer the following questions.

The production of rice and tea is more/ greater than production of wheat by-
A. 50%
B. 100%
C. 75%
D. 66.6%
Answer: Option B
Solution (By Examveda Team)
Rice + Tea = 55% + 5% = 60%Wheat = 30° = $$\frac{30}{30}$$ × 100 = 100%
Related Questions on Pie Chart
The annual savings in the form of provident fund would be:
A. Rs. 48456
B. Rs. 48540
C. Rs. 44856
D. Rs. 45480
A. Rs. 23545
B. Rs. 24435
C. Rs. 23555
D. Rs. 25355
The total amount per month, the family spends on food and entertainment combined together, is:
A. Rs. 11432
B. Rs. 11441
C. Rs. 12315
D. Rs. 12443

Join The Discussion