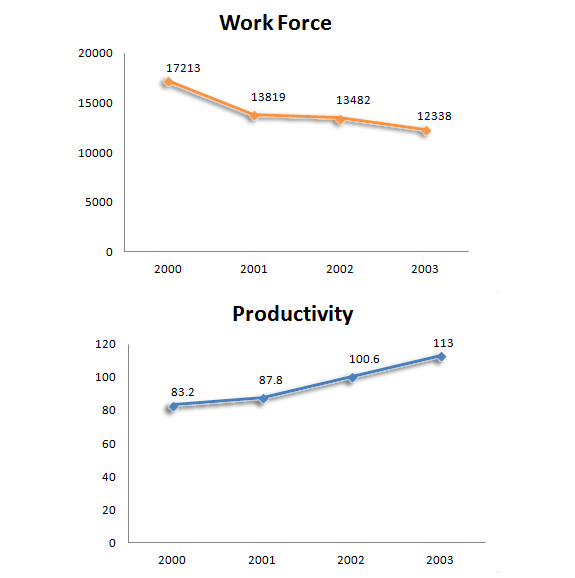
Directions (1 - 3): Answer the questions on the basis of following Line graph.
The change in Workforce and Productivity of Bajaj Auto For the Period 2000-2003

By how much percentage has production changed in 2003 as compared to its value for 2000?
A. -3%
B. +5%
C. 0%
D. +7%
Answer: Option A
Solution (By Examveda Team)
Change in production= 12338 - 17213
= - 4875
% change
= $$\frac{\text{-}4875}{17213}\times100$$
= -2.9%
≈ -3%
Join The Discussion
Comments (3)
Related Questions on Line Chart
What was the overall average expenditure of Company C in all the years together?
A. Rs. 190 lakhs
B. Rs. 120 lakhs
C. Rs. 180 lakhs
D. Rs. 150 lakhs
A. Rs. 1000000
B. Rs. 100000
C. Rs. 10000000
D. Rs. 100000000
In which year was the total expenditure by all three Companies together second highest?
A. 2005
B. 2006
C. 2007
D. 2008
E. 2009

2000 yr=17213*83.2=17*83=1411
2003 yr=12338*113=12*113=1356
(1411-1356)/1411
=(55/1411)*100
=3%
Y calculating work force
How we know that production by calculating work force?