
ExamVeda
Login
Home
This question belongs to Data Interpretation Line Chart
Read the following information
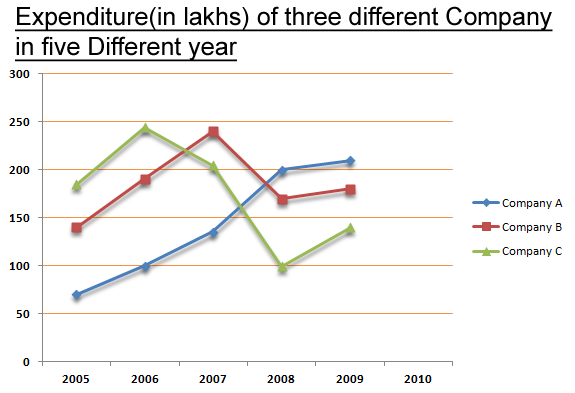
Directions (1 - 5): Study the graph and answer the questions:
Line Chart direction image
Line Chart
?

What was the overall average expenditure of Company C in all the years together?

Answer & Solution
Correct Answer: Option C
$$\eqalign{ & \text{Required average expenditure,} \cr & = \frac{200+250+210+100+140}{5} \cr & = \text{Rs. 180 lakhs} \cr} $$
Examveda
Question posted by Examveda
Community

Join the Discussion

3 Comments
Shalini Kumari
Shalini Kumari 4 years ago
How the points are determined here
Rupini Krishnaveni
Rupini Krishnaveni 5 years ago
How to calculate the values in line graph from 2005 to 2009
Rupini Krishnaveni
Rupini Krishnaveni 5 years ago
How to calculate the value in the line graph for the years 2005 to 2009