
?
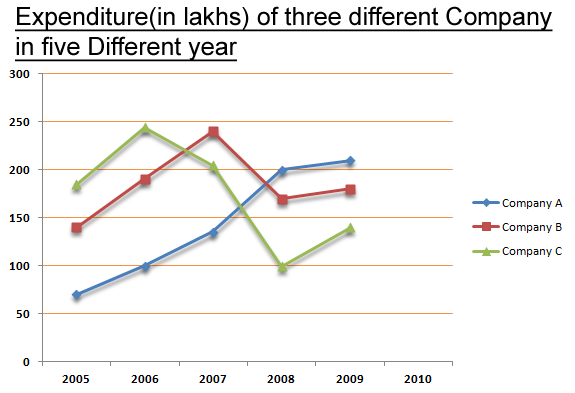
In which year was the total expenditure by all three Companies together second highest?
Answer & Solution
Correct Answer:
Option
B
Total expenditure of 3 companies in 2005,
= (80 + 140 + 200)
= Rs. 420 lakh
Total expenditure of 3 companies in 2006,
= (100 + 190 + 250)
= Rs. 540 lakh
Total expenditure of 3 companies in 2007,
= Rs. 580 lakh Total expenditure of 3 companies in 2008,
= Rs. 470 lakh Total expenditure of 3 companies in 2009,
= Rs. 530 lakh ∴ The required answer is 2006.

Join the Discussion
Login to post a comment or share your explanation.
Login