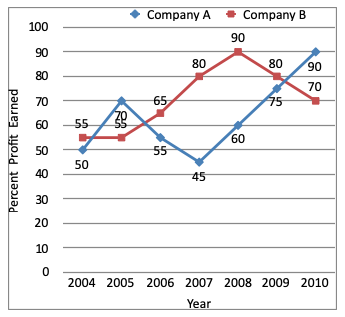
Directions (1 - 8): Study the following graphs carefully and answer the questions that follow:
Percent Profit Earned By Companies A and B Producing Electronic Goods Over The Years.
Percent Profit = $$\left( {\frac{{{\text{Profit Earned}}}}{{{\text{Total Investment}}}} \times 100} \right)\,\% $$
Profit Earned = (Total income ) - ( Total Investment in the Year)

If the income of Company A in 2007 and that in 2008 were equal and the amount invested in 2007 was Rs. 12 lakh, what was the amount invested in 2008?
A. Rs. 1087500
B. Rs. 1085700
C. Rs. 1245000
D. Rs. 1285000
E. None of these
Answer: Option A
Solution (By Examveda Team)
$$\eqalign{ & \text{Investment of A in 2007} \cr & = \text{Rs. 12 lakh and profit%} \cr & = 45\% \cr & \text{Income of A in 2007} \cr & = \text{Rs.}\left(\frac{145}{100}\times12\text{ lakh}\right) \cr & = \text{Rs. 17.4 lakh} \cr & \text{Amount invested by A in 2008} \cr & = \text{Rs.}\left(\frac{100}{160}\times17.4\text{ lakh}\right) \cr & = \text{Rs.}\left(10.875\times100000\right) \cr & = \text{Rs. 1087500} \cr} $$Related Questions on Line Chart
What was the overall average expenditure of Company C in all the years together?
A. Rs. 190 lakhs
B. Rs. 120 lakhs
C. Rs. 180 lakhs
D. Rs. 150 lakhs
A. Rs. 1000000
B. Rs. 100000
C. Rs. 10000000
D. Rs. 100000000
In which year was the total expenditure by all three Companies together second highest?
A. 2005
B. 2006
C. 2007
D. 2008
E. 2009

Join The Discussion