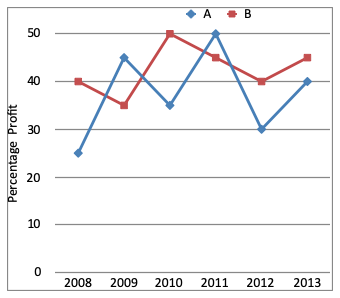
Directions (1 - 5): Study the following graph carefully and answer the questions given below it.
Percentage profit earned by two companies A and B over the six years.

| A | 25 | 45 | 35 | 50 | 30 | 40 |
| B | 40 | 35 | 50 | 45 | 40 | 45 |
If the income of company B in 2010 and 2011 were in the ratio of 2:3 respectively, what was the respective ratio of expenditures of that company in these two years?
A. 20 : 29
B. 9 : 10
C. 29 : 45
D. 10 : 29
E. None of these
Answer: Option C
Solution (By Examveda Team)
$$\eqalign{ & \text{In 2010, 50} = \frac{2-E_1}{E_1}\times100 \cr & \Rightarrow 50\,E_1= 200-100\,E_1 \cr & \Rightarrow 150\,E_1 = 200 \cr & \Rightarrow E_1 = \frac{4}{3} \cr & \text{In 2011, 45} = \frac{3-E_2}{E_2}\times100 \cr & \Rightarrow 45\,E_2 = 300 - 100\,E_2 \cr & \Rightarrow 145\,E_2=300 \cr & \Rightarrow E_2= \frac{300}{145} \cr & \text{Then, }\frac{E_1}{E_2} = \frac{4}{3}\times\frac{145}{300} \cr & \Rightarrow \frac{E_1}{E_2} = \frac{29}{45} \cr & \Rightarrow E_1:E_2=29:45 \cr} $$Related Questions on Line Chart
What was the overall average expenditure of Company C in all the years together?
A. Rs. 190 lakhs
B. Rs. 120 lakhs
C. Rs. 180 lakhs
D. Rs. 150 lakhs
A. Rs. 1000000
B. Rs. 100000
C. Rs. 10000000
D. Rs. 100000000
In which year was the total expenditure by all three Companies together second highest?
A. 2005
B. 2006
C. 2007
D. 2008
E. 2009

Join The Discussion