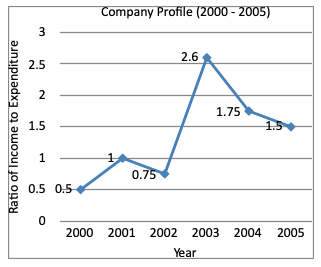
Directions (1 - 2): Study the following graph and answer the questions.

If the income shows positive growth every year throughout the period (2000-2005), then in how many years the expenditure shows a positive growth?
A. 5
B. 3
C. 4
D. 2
Answer: Option D
Solution (By Examveda Team)
It is clear from the graph.Related Questions on Line Chart
What was the overall average expenditure of Company C in all the years together?
A. Rs. 190 lakhs
B. Rs. 120 lakhs
C. Rs. 180 lakhs
D. Rs. 150 lakhs
A. Rs. 1000000
B. Rs. 100000
C. Rs. 10000000
D. Rs. 100000000
In which year was the total expenditure by all three Companies together second highest?
A. 2005
B. 2006
C. 2007
D. 2008
E. 2009

Join The Discussion