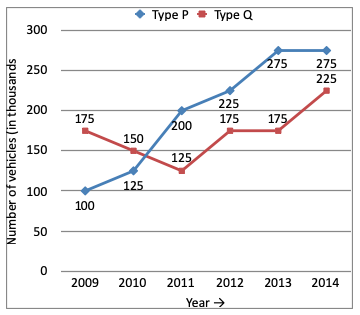
Directions (1 - 5): The following graph shows productions (in thousands) of two types (P and Q) of vehicles by a factory over the years 2009 to 2014. Study the graph and answer five questions.

In how many of the given years, was the production of Type P vehicles of the company more than the average production of this type vehicles in the given years?
A. 3
B. 5
C. 2
D. 4
Answer: Option A
Solution (By Examveda Team)
Average production (Type P) = 200No. of years production of Type P is higher than average = 3
Related Questions on Line Chart
What was the overall average expenditure of Company C in all the years together?
A. Rs. 190 lakhs
B. Rs. 120 lakhs
C. Rs. 180 lakhs
D. Rs. 150 lakhs
A. Rs. 1000000
B. Rs. 100000
C. Rs. 10000000
D. Rs. 100000000
In which year was the total expenditure by all three Companies together second highest?
A. 2005
B. 2006
C. 2007
D. 2008
E. 2009

Join The Discussion