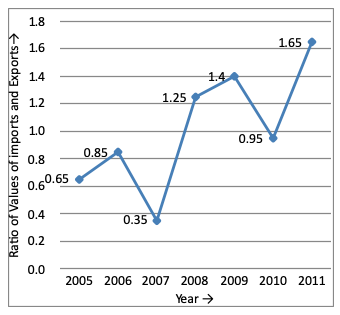
Directions (1 - 5): The following line – graph gives the ratio of the amounts of imports by a company to the amount of exports from that company over the period from 2005 to 2011.

In how many of the given years were the exports more than the imports?
A. 1 years
B. 2 years
C. 3 years
D. 4 years
E. None of these
Answer: Option D
Solution (By Examveda Team)
Clearly, Export > Import only when $$\frac{\text{Import}}{\text{Export}}$$ < 1.From the graph it is clear that the above ratio is less than 1 in the years 2005, 2006, 2007 and 2010.
Thus (Imports : Exports) < 1 in 4 years
Related Questions on Line Chart
What was the overall average expenditure of Company C in all the years together?
A. Rs. 190 lakhs
B. Rs. 120 lakhs
C. Rs. 180 lakhs
D. Rs. 150 lakhs
A. Rs. 1000000
B. Rs. 100000
C. Rs. 10000000
D. Rs. 100000000
In which year was the total expenditure by all three Companies together second highest?
A. 2005
B. 2006
C. 2007
D. 2008
E. 2009

Join The Discussion