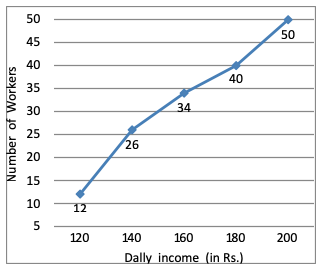
Directions (1 - 2): The graph given below shows the daily income of 50 workers in a factory. Study the graph and answer the questions.

The median wages in the factory is:
A. Rs. 140
B. Rs. 138
C. Rs. 150
D. Rs. 160
Answer: Option D
Solution (By Examveda Team)
$$\eqalign{ & \text{Median} \cr & = \frac{\text{L.V + H.V}}{2} \cr & = \frac{120 + 200}{2} \cr & = \text{Rs. }160 \cr}$$Related Questions on Line Chart
What was the overall average expenditure of Company C in all the years together?
A. Rs. 190 lakhs
B. Rs. 120 lakhs
C. Rs. 180 lakhs
D. Rs. 150 lakhs
A. Rs. 1000000
B. Rs. 100000
C. Rs. 10000000
D. Rs. 100000000
In which year was the total expenditure by all three Companies together second highest?
A. 2005
B. 2006
C. 2007
D. 2008
E. 2009

Join The Discussion