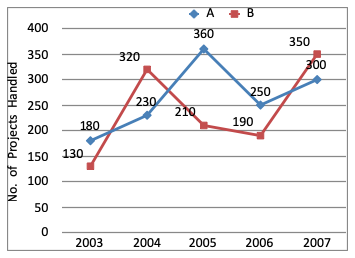
Directions (1 - 5): Refer to the graph and answer the given questions:
Data related to the number of projects handled by two companies A and B over 5 years.

The number of projects handled by company B decreased by what percent from 2004 to 2006?
A. $$35\frac{5}{8}$$ %
B. $$30\frac{7}{8}$$ %
C. $$50\frac{3}{8}$$ %
D. $$45\frac{3}{8}$$ %
E. $$40\frac{5}{8}$$ %
Answer: Option E
Solution (By Examveda Team)
Number of projects handled by company B in 2004 = 320Number of projects handled by company B in 2006 = 190
Required decrease percentage
$$\eqalign{ & = \frac{320-190}{320}\times100 \cr & = \frac{130}{320}\times100 \cr & = \frac{1300}{32}\% \cr & = \frac{325}{8}\% \cr & = 40\frac{5}{8}\% \cr} $$
Related Questions on Line Chart
What was the overall average expenditure of Company C in all the years together?
A. Rs. 190 lakhs
B. Rs. 120 lakhs
C. Rs. 180 lakhs
D. Rs. 150 lakhs
A. Rs. 1000000
B. Rs. 100000
C. Rs. 10000000
D. Rs. 100000000
In which year was the total expenditure by all three Companies together second highest?
A. 2005
B. 2006
C. 2007
D. 2008
E. 2009

Join The Discussion