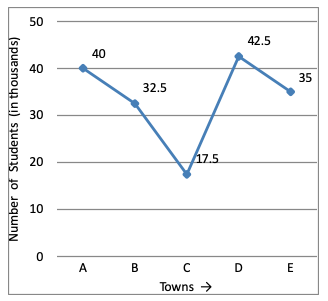
Directions (1 - 5): Study the following line graph carefully and answer the questions given below:
Number of Students Appearing For Aptitude Test From Various Town (In Thousands).

The number of students appearing for the Aptitude Test from Town E is approximately what percent of the total number of students appearing for the Aptitude Test from all the towns together?
A. 15%
B. 17%
C. 19%
D. 21%
E. 23%
Answer: Option D
Solution (By Examveda Team)
$$\eqalign{ & \text{Required %} \cr & = \left(\frac{35\times1000}{167.5\times1000}\times100\right)\% \cr & = \frac{350\times100}{1675}\% \cr & = \frac{1400}{67}\% \cr & = 20.89\% \cr & \approx 21\% \cr} $$Related Questions on Line Chart
What was the overall average expenditure of Company C in all the years together?
A. Rs. 190 lakhs
B. Rs. 120 lakhs
C. Rs. 180 lakhs
D. Rs. 150 lakhs
A. Rs. 1000000
B. Rs. 100000
C. Rs. 10000000
D. Rs. 100000000
In which year was the total expenditure by all three Companies together second highest?
A. 2005
B. 2006
C. 2007
D. 2008
E. 2009

Join The Discussion