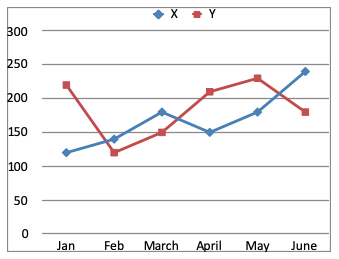
Directions (1 - 5): Refer to the graph and answer the given questions:
Number of watches of ‘PQR’ brand sold in Town X and Y in 6 different Months.

| Town X | 120 | 140 | 180 | 150 | 180 | 240 |
| Town Y | 220 | 120 | 150 | 210 | 230 | 180 |
The number of watches sold in Town X in July was 10% more than the number of watches sold in the same town in May. What is the ratio of the number of watches sold in July to that sold in January in the same town?
A. 34 : 23
B. 32 : 25
C. 31 : 20
D. 33 : 23
E. 33 : 20
Answer: Option E
Solution (By Examveda Team)
Number of watches sold in Town X in the month of May = 180Number of watches sold in Town X in the month of July
= $$\frac{180\times110}{100}$$
= 198
Number of watches sold in Town X in the month of January = 120
∴ Required ratio
$$\eqalign{ & = \frac{198}{120} \cr & = \frac{33}{20} \cr & = 33:20\cr} $$
Related Questions on Line Chart
What was the overall average expenditure of Company C in all the years together?
A. Rs. 190 lakhs
B. Rs. 120 lakhs
C. Rs. 180 lakhs
D. Rs. 150 lakhs
A. Rs. 1000000
B. Rs. 100000
C. Rs. 10000000
D. Rs. 100000000
In which year was the total expenditure by all three Companies together second highest?
A. 2005
B. 2006
C. 2007
D. 2008
E. 2009

Join The Discussion