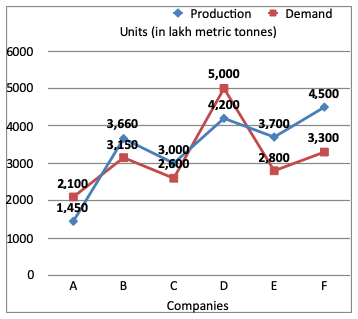
Directions (1 - 3): The graph shows the demand and production of different companies. Study the graph and answer the given questions.

The production of company A is approximately what percent of the demand of company C?
A. 50%
B. 60%
C. 55%
D. 65%
Answer: Option C
Solution (By Examveda Team)
$$\eqalign{ & = \text{Required answer} \cr & = \frac{\text{Production of A}}{\text{Demand of C}} \times 100 \cr & = \frac{1450}{2600} \times 100\% \cr & = 55\%\, \left( \text{App.}\right) \cr} $$Related Questions on Line Chart
What was the overall average expenditure of Company C in all the years together?
A. Rs. 190 lakhs
B. Rs. 120 lakhs
C. Rs. 180 lakhs
D. Rs. 150 lakhs
A. Rs. 1000000
B. Rs. 100000
C. Rs. 10000000
D. Rs. 100000000
In which year was the total expenditure by all three Companies together second highest?
A. 2005
B. 2006
C. 2007
D. 2008
E. 2009

Join The Discussion