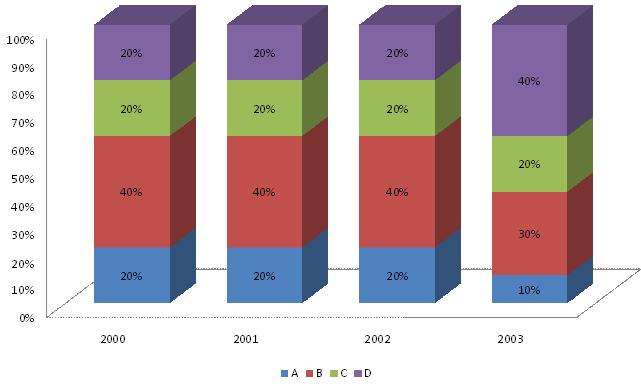
Directions (1 - 5): The cumulative bar chart below gives us the production of four Products A, B, C and D for four years. It is known that the total production increases @20% over its value in the previous year. The difference between C's production in 2003 and A's production in 2001 is 2640 units.
Production of A, B, C and D.

If the price of B is Rs. 125 per unit, what is the sales revenue in the same year due to sale of B (in Rupees Lakhs)?
A. 15 lakh
B. 12.5 lakh
C. 20 lakh
D. 25 lakh
Answer: Option A
Solution (By Examveda Team)
Assume the total production of the first year as 10000, second year becomes 12000, third year 14400 and fourth year 17280. Then, 0.2 × 17280 - 0.2 × 12000 = 1056 But this difference is given as 2640. Hence, the value of production will be; 25000, 30000, 36000, and 43200 respectively for the 4 years. ∴ Revenue= 125 × 0.4 × 30000
= 1500000
Related Questions on Bar Chart
The percent increase in population from 1991 to 2001 is:
A. 24.8 crores
B. 20 crores
C. 13.6 crores
D. 22.9 crores
Per year increase in population from the year 1951 to 2001 is
A. 8100000
B. 7600000
C. 8900000
D. 6700000

Join The Discussion