
ExamVeda
Login
Home
This question belongs to Data Interpretation Bar Chart
Read the following information
Directions (1 - 4): Study the graph and answer the questions:
The bar chart give
Bar Chart direction image
Bar Chart
?

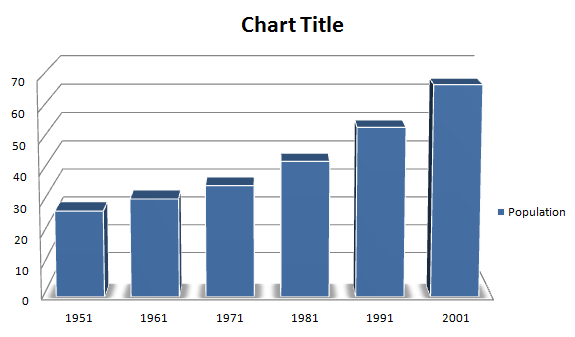
The percent increase in population from 1991 to 2001 is:

Answer & Solution
Correct Answer: Option C
Increase in Population
= 68.40 - 54.80
= 13.6 crores
Examveda
Question posted by Examveda
Community

Join the Discussion

7 Comments
Gadisa Begna
Gadisa Begna 11 months ago
Please explain in detail
DEBASIS ROUT
DEBASIS ROUT 2 years ago
Wrong question with wrong answer...here question asked in percentage and you gave answer in value and that too wrong ans..
Kunal Sharma
Kunal Sharma 5 years ago
when we see this graph and when we assume the values of 1991 is 45 because it lies b/w 50 and 40 and in 2001 its value we assume is 60 because its lies in 60. We subtract this values 60-45=15 how did you get the 13.6cr as a answer please explain us.
Aarti Manral
Aarti Manral 6 years ago
Explain it in detail. Not understandable
Sarita Talwar
Sarita Talwar 6 years ago
The Value of 68.4 as provided in the explanation is not visible. How did you get these values
Sukriti Sharma
Sukriti Sharma 8 years ago
Explain it in detail. Not understandable
Mohd Zubair
Mohd Zubair 9 years ago
2001 graph in lying on 60-62 not to close to 70s line so how u declare 68.4
same for 1991 graph