
?
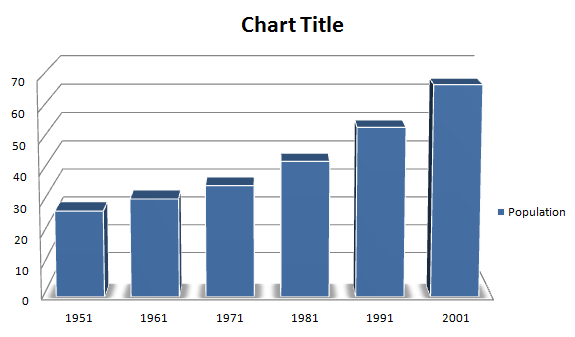
Per year increase in population from the year 1951 to 2001 is
Answer & Solution
Correct Answer:
Option
A
Total increase
= 68.40 - 27.90
= 40.5 crores
Hence, annual increase
$$\eqalign{ & = \frac{40.5}{50} \text{ crores} \cr & = \frac{40.5\times10000000}{50} \cr & = 8100000 \cr} $$
= 68.40 - 27.90
= 40.5 crores
Hence, annual increase
$$\eqalign{ & = \frac{40.5}{50} \text{ crores} \cr & = \frac{40.5\times10000000}{50} \cr & = 8100000 \cr} $$

Join the Discussion
Login to post a comment or share your explanation.
Login