
?
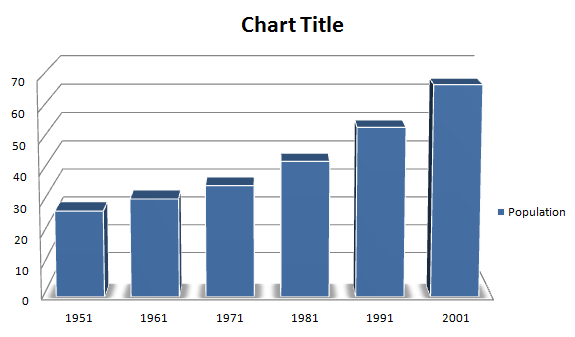
In which census year, the per cent increase in population is least as compared to that in the previous census year?
Answer & Solution
Correct Answer:
Option
A
% increase in 1971
= [(36.14 × 31.85) × 100]
= 13.47% least in all
= [(36.14 × 31.85) × 100]
= 13.47% least in all

Join the Discussion
Login to post a comment or share your explanation.
Login