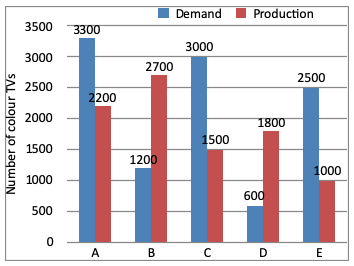
Directions(1 - 4): Study the bar diagram and answer the following questions.
Demand and production of colour TV of five companies A, B, C, D, and E.

The difference between average demand and average production of the five companies taken together is:
A. 1400
B. 400
C. 280
D. 138
Answer: Option C
Solution (By Examveda Team)
Required difference= $$ \frac{3300 + 1200 + 3000 + 600 + 2500}{5}$$ $$ -\, \frac{2200 + 2700 + 1500 + 1800 + 1000}{5}$$
= 2120 - 1840
= 280
Related Questions on Bar Chart
The percent increase in population from 1991 to 2001 is:
A. 24.8 crores
B. 20 crores
C. 13.6 crores
D. 22.9 crores
Per year increase in population from the year 1951 to 2001 is
A. 8100000
B. 7600000
C. 8900000
D. 6700000

Join The Discussion