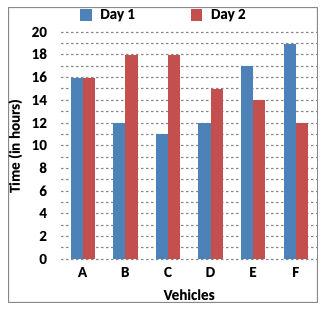
Direction (1 - 5): Study the following bar graph and the table carefully and answer the questions given below:
Time Taken (in hours) by 6 Vehicles on Two Different Days

Distance Covered (in km) by 6 Vehicles on Each Day
| Vehicles | Day 1 | Day 2 |
| A | 832 | 864 |
| B | 516 | 774 |
| C | 693 | 810 |
| D | 552 | 765 |
| E | 935 | 546 |
| F | 703 | 636 |
The distance travelled by vehicle F on Day 2 was approximately what percent of the distance travelled by it on Day 1?
A. 80%
B. 65%
C. 85%
D. 95%
E. 90%
Answer: Option E
Solution (By Examveda Team)
$$\eqalign{ & \text{Speeds of vehicles on Day 1:} \cr & \text{A → } \frac{832}{16}\text{ km/hr}=\text{52 km/hr} \cr & \text{B → } \frac{516}{12}\text{ km/hr}=\text{43 km/hr} \cr & \text{C → } \frac{693}{11}\text{ km/hr}=\text{63 km/hr} \cr & \text{D → } \frac{552}{12}\text{ km/hr}=\text{46 km/hr} \cr & \text{E → } \frac{935}{17}\text{ km/hr}=\text{55 km/hr} \cr & \text{F → } \frac{703}{19}\text{ km/hr}=\text{37 km/hr} \cr & \cr & \text{Speed of vehicles on Day 2:} \cr & \text{A → } \frac{864}{16}\text{ km/hr}=\text{54 km/hr} \cr & \text{B → } \frac{774}{18}\text{ km/hr}=\text{43 km/hr} \cr & \text{C → } \frac{810}{18}\text{ km/hr}=\text{45 km/hr} \cr & \text{D → } \frac{765}{15}\text{ km/hr}=\text{51 km/hr} \cr & \text{E → } \frac{546}{14}\text{ km/hr}=\text{39 km/hr} \cr & \text{F → } \frac{636}{12}\text{ km/hr}=\text{53 km/hr} \cr} $$$$\eqalign{ & \text{Required %} \cr & = \left(\frac{636}{703}\times100\right)\% \cr & = \frac{63600}{703}\% \cr & = 90.46\% \cr & \approx 90\% \cr} $$
Join The Discussion
Comments (1)
Related Questions on Bar Chart
The percent increase in population from 1991 to 2001 is:
A. 24.8 crores
B. 20 crores
C. 13.6 crores
D. 22.9 crores
Per year increase in population from the year 1951 to 2001 is
A. 8100000
B. 7600000
C. 8900000
D. 6700000

What type of question is this?
Question is saying to find distance and solution is about finding speed..... please clarify if I’m wrong.