
?
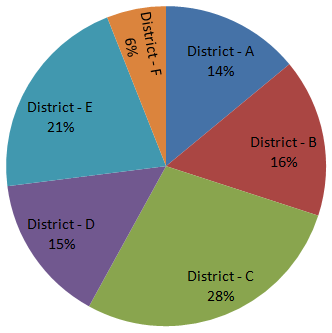
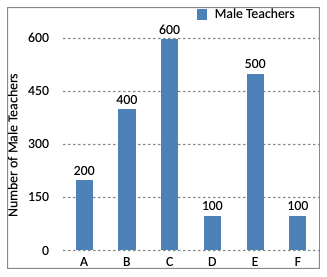
The number of female teachers in District D is approximately what percent of the total number of teachers (both male & female) in District A?
Answer & Solution
Correct Answer:
Option
E
$$\eqalign{
& \text{Total number of teachers in:} \cr
& \text{A → } \frac{14}{100}\times4500 = 630\cr
& \text{B → } \frac{16}{100}\times4500 = 720\cr
& \text{C → } \frac{28}{100}\times4500 = 1260\cr
& \text{D → } \frac{15}{100}\times4500 = 675\cr
& \text{E → } \frac{21}{100}\times4500 = 945\cr
& \text{F → } \frac{6}{100}\times4500 = 270\cr} $$
Female teacher in D = 575
Total number of teacher in A
= 200 + 430
= 630
∴ Required percentage
$$\eqalign{ & = \left(\frac{575}{630}\times100\right)\% \cr & = \frac{5750}{63}\% \cr & = 91.2\% \cr & \approx 90\% \cr} $$
| A | B | C | D | E | F | |
| Males | 200 | 400 | 600 | 100 | 500 | 100 |
| Females | 430 | 320 | 660 | 575 | 445 | 170 |
Female teacher in D = 575
Total number of teacher in A
= 200 + 430
= 630
∴ Required percentage
$$\eqalign{ & = \left(\frac{575}{630}\times100\right)\% \cr & = \frac{5750}{63}\% \cr & = 91.2\% \cr & \approx 90\% \cr} $$

Join the Discussion
Login to post a comment or share your explanation.
Login