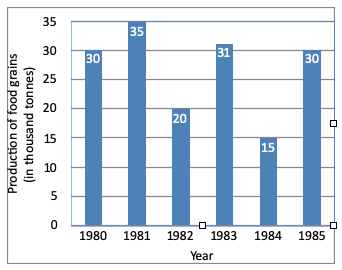
Directions (1 - 4): The graph shows the production of food grains of a country in different. Study the graph and answer the questions.

The sum of the production of food grains in the year 1982 and 1984 is equal to that in the year:
A. 1980
B. 1981
C. 1983
D. 1985
Answer: Option B
Solution (By Examveda Team)
From the graph:Sum of 1982 and 1984
= 20 + 15
= 35
Which is equal to the production of 1981
Related Questions on Bar Chart
The percent increase in population from 1991 to 2001 is:
A. 24.8 crores
B. 20 crores
C. 13.6 crores
D. 22.9 crores
Per year increase in population from the year 1951 to 2001 is
A. 8100000
B. 7600000
C. 8900000
D. 6700000

Join The Discussion