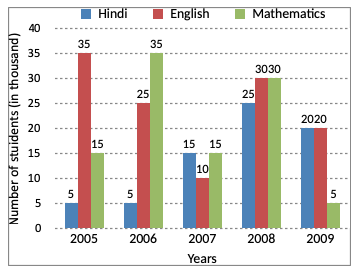
Directions (1 - 5): Study the following graph carefully and answer the questions that follow:
No. Of students (in thousands) who opted for Three Different Specializations during the Given Five Years in a University.

The total number of students who opted for Mathematics in the years 2005 and 2008 together is approximately what percent of the total number of students who opted for all three subjects in the same years?
A. 38%
B. 28%
C. 42%
D. 32%
E. 48%
Answer: Option D
Solution (By Examveda Team)
Number of students opting Mathematics in 2005 and 2008= 15000 + 30000
= 45000
Number of students opting for these three subjects in 2005 and 2008
= {(5 + 35 + 15) + (25 + 30 + 30)} thousands
= 55000 + 85000
= 140000
$$\eqalign{ & \text{Required %} \cr & = \left(\frac{45000}{140000}\times100\right)\% \cr & = \frac{225}{7}\% \cr & = 32.14\% \cr & \approx 32\% \cr} $$
Related Questions on Bar Chart
The percent increase in population from 1991 to 2001 is:
A. 24.8 crores
B. 20 crores
C. 13.6 crores
D. 22.9 crores
Per year increase in population from the year 1951 to 2001 is
A. 8100000
B. 7600000
C. 8900000
D. 6700000

Join The Discussion