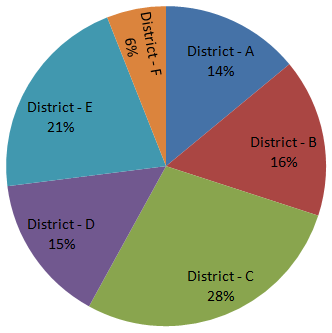
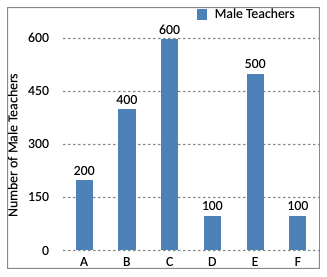
Directions (1 - 5): Study the following pie-chart and bar graph and answer the questions that follows:
Percentage-wise distribution of Teachers in 6 Districts.

Number of males in each district out of 4500 Teachers.

What is the difference between the number of female teachers in District F and the total number of teachers (both male and female) in District E?
A. 625
B. 775
C. 675
D. 725
E. None of these
Answer: Option B
Solution (By Examveda Team)
$$\eqalign{ & \text{Total number of teachers in:} \cr & \text{A → } \frac{14}{100}\times4500 = 630\cr & \text{B → } \frac{16}{100}\times4500 = 720\cr & \text{C → } \frac{28}{100}\times4500 = 1260\cr & \text{D → } \frac{15}{100}\times4500 = 675\cr & \text{E → } \frac{21}{100}\times4500 = 945\cr & \text{F → } \frac{6}{100}\times4500 = 270\cr} $$| A | B | C | D | E | F | |
| Males | 200 | 400 | 600 | 100 | 500 | 100 |
| Females | 430 | 320 | 660 | 575 | 445 | 170 |
Number of female teachers in F = 170
Total number of teachers in E
= 500 + 445
= 945
∴ Required difference
= 945 - 170
= 775
Related Questions on Bar Chart
The percent increase in population from 1991 to 2001 is:
A. 24.8 crores
B. 20 crores
C. 13.6 crores
D. 22.9 crores
Per year increase in population from the year 1951 to 2001 is
A. 8100000
B. 7600000
C. 8900000
D. 6700000

Join The Discussion