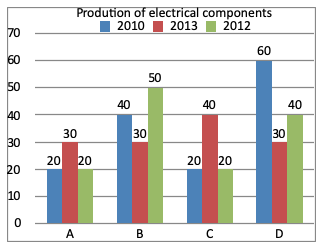
Directions (1 - 4): Study the following graph carefully and answer the given questions.

Which company has the highest average production over the three years?
A. Company A
B. Company C
C. Company D
D. Company B
Answer: Option C
Solution (By Examveda Team)
$$\eqalign{ & \text{A} = \frac{20 + 30 + 20}{3} \cr & \,\,\,\,\, = \frac{70}{3} \cr & \,\,\,\,\, = 23.33 \cr & \cr & \text{B} = \frac{40 + 30 + 50}{3} \cr & \,\,\,\,\, = \frac{120}{3} \cr & \,\,\,\,\, = 40 \cr & \cr & \text{C} = \frac{20 + 20 + 40}{3} \cr & \,\,\,\,\, = \frac{80}{3} \cr & \,\,\,\,\, = 26.66 \cr & \cr & \text{D} = \frac{60 + 30 + 40}{3} \cr & \,\,\,\,\, = \frac{130}{3} \cr & \,\,\,\,\, = 43.33 \cr} $$So company D has the highest production.
Related Questions on Bar Chart
The percent increase in population from 1991 to 2001 is:
A. 24.8 crores
B. 20 crores
C. 13.6 crores
D. 22.9 crores
Per year increase in population from the year 1951 to 2001 is
A. 8100000
B. 7600000
C. 8900000
D. 6700000

Join The Discussion