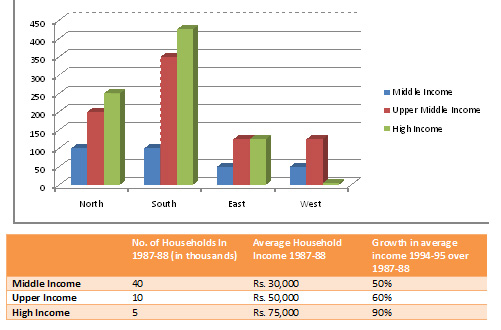
Directions (1 - 4) The following bar chart gives the growth percentage in the number of households in middle, upper-middle and high-income categories in the four regions for the period between 1987-88 and 1994-95.

Which region showed the highest growth in number of households in all the income categories for the period ?
A. North
B. South
C. West
D. None of these
Answer: Option B
Solution (By Examveda Team)
From graph it is clear that southern region showed the highest growth in number of households in all the income categories for the period.Related Questions on Bar Chart
The percent increase in population from 1991 to 2001 is:
A. 24.8 crores
B. 20 crores
C. 13.6 crores
D. 22.9 crores
Per year increase in population from the year 1951 to 2001 is
A. 8100000
B. 7600000
C. 8900000
D. 6700000

Join The Discussion