
ExamVeda
Login
Home
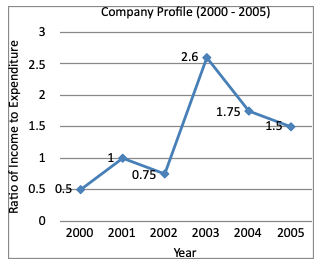
Directions (1 - 2): Study the following graph and answer the questions.
Direction image of Line Chart chapter
1
If the income shows positive growth every year throughout the period (2000-2005), then in how many years the expenditure shows a positive growth?
Discuss
Answer & Solution
It is clear from the graph.
2
Find the percentage decrease in income from 2001 to 2002.
Discuss
Answer & Solution
$$\eqalign{ & 2001 : \frac{\text{I}}{\text{E}} = \frac{1}{1} = \frac{4}{4} \cr & 2002 : \frac{\text{I}}{\text{E}} = \frac{75}{100} = \frac{3}{4} \cr & \text{Income} \% = \frac{4 - 3}{4} \times 100 = 25\% \cr}$$