
ExamVeda
Login
Home
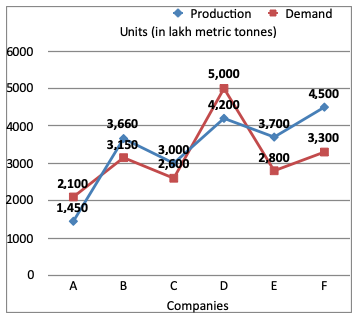
Directions (1 - 3): The graph shows the demand and production of different companies. Study the graph and answer the given questions.
Direction image of Line Chart chapter
1
The production of company A is approximately what percent of the demand of company C?
Discuss
Answer & Solution
$$\eqalign{ & = \text{Required answer} \cr & = \frac{\text{Production of A}}{\text{Demand of C}} \times 100 \cr & = \frac{1450}{2600} \times 100\% \cr & = 55\%\, \left( \text{App.}\right) \cr} $$
2
What is the ratio of the companies having more demand then production to those having more production than demand?
Discuss
Answer & Solution
$$\eqalign{ & \text{Required ratio} \cr & = \frac{\left(\text{A + D}\right)}{\left(\text{B, C, E and F}\right)} \cr & = \frac{2}{4} \cr & = \frac{1}{2} \cr & = 1:2 \cr} $$
3
The demand of company B is what percentage of the production of company A?
Discuss
Answer & Solution
$$\eqalign{ & \text{Required%} \cr & = \frac{\text{Demand fo B}}{\text{Profit of F}} \times 100\% \cr & = \frac{3150}{4500} \times 100 \cr & = 70\% \cr} $$