
?
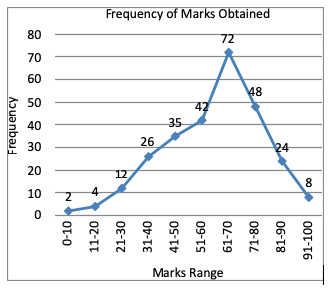
If 40 is the pass marks, percentage of students failed is-
Answer & Solution
Correct Answer:
Option
C
Number of students who got 40% or less marks
= 2 + 4 + 12 + 26
= 44
∴ Required percentage
$$\eqalign{ & = \frac{44}{273} \times 100 \cr & = 16.11\% \cr} $$
= 2 + 4 + 12 + 26
= 44
∴ Required percentage
$$\eqalign{ & = \frac{44}{273} \times 100 \cr & = 16.11\% \cr} $$

Join the Discussion
Login to post a comment or share your explanation.
Login