
?
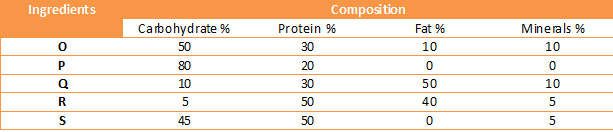
In what proportion P, Q and S should be mixed to make a diet having least 60% carbohydrate at the lowest per unit cost?
Answer & Solution
Correct Answer:
Option
E
To make diet with at lest 60% carbohydrate we can use option (B) and (E) only, but the lowest cost per unit can be given by when P, Q and S are mixed in the ratio 4 : 1 : 1

Join the Discussion
Login to post a comment or share your explanation.
LoginPrice of Q = Rs. 200.
Price of S = Rs. 100.
First condition = at least 60% Carbohydrates.
Second Condition = Lowest Cost.
If You take option 1.
2 unit, 1 unit and 3 unit. In this
% of Carbohydrate = (2/6) *100 = 33.33%. (Not qualify the first condition).
Similarly, Option 3 and for also will not qualify the first condition. You can do the calculation yourself. Then, we left with option 2 and 5 which may contain 60% carbohydrates. But, Option 2 also don't qualify condition 1.
4/7 = 5.7 = 57%.
Option 5.
Carbohydrate = 4/6 = 6.66 = 66.6%. So, option 5 is correct .