
?
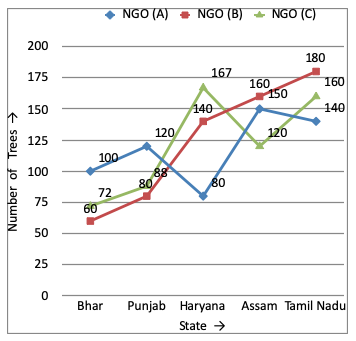
In which of the following states was the total number of trees planted by NGOs A and B together second lowest?
Answer & Solution
Correct Answer:
Option
B
Total number of trees planted by A and B in:
Bihar → 100 + 60 = 160
Punjab → 120 + 80 = 200
Haryana → 140 + 80 = 220
Assam → 150 + 160 = 310
Tamil Nadu → 140 + 180 = 320
It is second lowest in Punjab
Bihar → 100 + 60 = 160
Punjab → 120 + 80 = 200
Haryana → 140 + 80 = 220
Assam → 150 + 160 = 310
Tamil Nadu → 140 + 180 = 320
It is second lowest in Punjab

Join the Discussion
Login to post a comment or share your explanation.
Login