
ExamVeda
Login
Home
This question belongs to Data Interpretation Table Chart
Read the following information
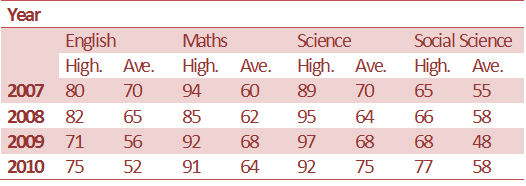
Directions (1 - 4): Study the table and answer the questions:
The table given here
Table Chart direction image
Table Chart
?

In which year, the difference between the highest and the average marks in Maths was maximum?

Answer & Solution
Correct Answer: Option C
Difference in 2007 is 34 which is maximum.
Examveda
Question posted by Examveda
Community

Join the Discussion

1 Comment
Debendra Mahanandia
Debendra Mahanandia 9 years ago
Correct