
ExamVeda
Login
Home
This question belongs to Data Interpretation Line Chart
Read the following information
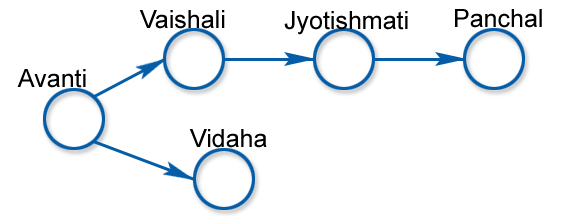
Directions (1 - 3): The following sketch shows the pipeline carrying material from one location to another. Each location has a demand for material. The demand Vaishali is 400, at Jyotishmati is 400, at Panchal is 700 and Vidisha is 200. Each arrow indicates the direction of material flow through the pipeline. The flow from Vaishali to Jyotishmati is 300. The quantity of material flow is such that the demands at all these locations are exactly met. The capacity of each pipeline is 1.
Line Chart direction image
Line Chart
?

Quantity moved Avanti to Vidisha is :

Answer & Solution
Correct Answer: Option D
Jyotishmati gets supply from two direction one from Vaishali max 300 and rest from Vidisha. all supply given to Panchal is received and supplies 100 for Jyotishmati because it receives only 300 (max flow) from Vaishali.
Hence, quantity moved from Avanti to Vidisha,
= 200 + 100 + 700
= 1000
Examveda
Question posted by Examveda
Community

Join the Discussion

No comments yet Be the first to discuss this question.