
ExamVeda
Login
Home
This question belongs to Data Interpretation Line Chart
Read the following information
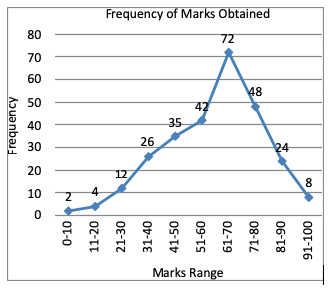
Directions (1 - 4): The marks obtained by 273 examinees are shown by the frequency polygon. Given that mean marks is 59.5. Study the frequency polygon and answer the given questions.
Direction image of Line Chart chapter
Line Chart
?

The number of examinees getting more than average marks is:

Answer & Solution
Correct Answer: Option C
Number of examinees getting more than the average marks
= 72 + 48 + 24 + 8
= 152
Examveda
Question posted by Examveda
Community

Join the Discussion

No comments yet Be the first to discuss this question.