
?
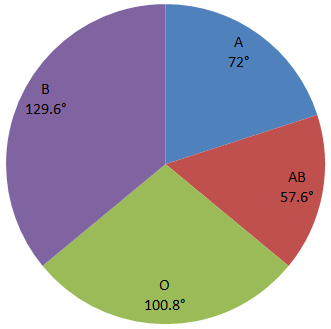
The number of persons having either blood group ‘A’ or blood group ‘B’ is:
Answer & Solution
Correct Answer:
Option
A
Person having blood group A or B
$$\eqalign{ & = \frac{129.6° + 72°}{360}\times150 \cr & = 84 \cr} $$
$$\eqalign{ & = \frac{129.6° + 72°}{360}\times150 \cr & = 84 \cr} $$

Join the Discussion
Login to post a comment or share your explanation.
Login