
?
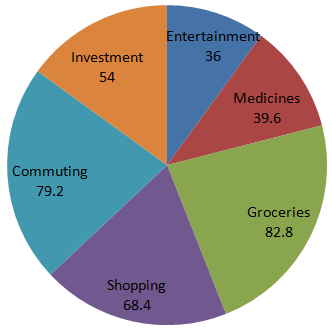
The total amount spent by the family on Groceries, Entertainment and Investment together forms approximately what percent of the amount spent on Commuting?
Answer & Solution
Correct Answer:
Option
E
Percentage Break-up of expenditure is:
$$\eqalign{ & \text{Investments →} \left(\frac{54}{360}\times100\right)\% \cr & \,\,\,\,\,\,\,\,\,\,\,\,\,\,\,\,\,\,\,\,\,\,\,\,\,\,\,\,\,\,\,\,\,\,\, = 15\% \cr & \text{Commuting →} \left(\frac{79.2}{360}\times100\right)\% \cr & \,\,\,\,\,\,\,\,\,\,\,\,\,\,\,\,\,\,\,\,\,\,\,\,\,\,\,\,\,\,\,\,\,\, = 22\% \cr & \text{Shopping →} \left(\frac{68.4}{360}\times100\right)\% \cr & \,\,\,\,\,\,\,\,\,\,\,\,\,\,\,\,\,\,\,\,\,\,\,\,\,\,\,\, = 19\% \cr & \text{Groceries →} \left(\frac{82.8}{360}\times100\right)\% \cr & \,\,\,\,\,\,\,\,\,\,\,\,\,\,\,\,\,\,\,\,\,\,\,\,\,\,\,\,\, = 23\% \cr & \text{Medicines →} \left(\frac{39.6}{360}\times100\right)\% \cr & \,\,\,\,\,\,\,\,\,\,\,\,\,\,\,\,\,\,\,\,\,\,\,\,\,\,\,\,\,\, = 11\% \cr & \text{Entertainment →} \left(\frac{36} {360}\times100\right)\% \cr & \,\,\,\,\,\,\,\,\,\,\,\,\,\,\,\,\,\,\,\,\,\,\,\,\,\,\,\,\,\,\,\,\,\,\,\,\,\,\,\,\,\,\, = 10\% \cr} $$
Amount spent on Groceries, Entertainment and Investments
$$\eqalign{ & = 45800\times\frac{23+10+15}{100} \cr & = 45800\times\frac{48}{100} \cr & \text{Amount spent on Commuting} \cr & = 45800\times\frac{22}{100} \cr & \text{Required %} \cr & = \left(\frac{45800\times\frac{48}{100}}{45800\times\frac{22}{100}}\times100\right)\% \cr & = \frac{2400}{11}\% \cr & = 218.18\% \cr & \approx 218\% \cr} $$
$$\eqalign{ & \text{Investments →} \left(\frac{54}{360}\times100\right)\% \cr & \,\,\,\,\,\,\,\,\,\,\,\,\,\,\,\,\,\,\,\,\,\,\,\,\,\,\,\,\,\,\,\,\,\,\, = 15\% \cr & \text{Commuting →} \left(\frac{79.2}{360}\times100\right)\% \cr & \,\,\,\,\,\,\,\,\,\,\,\,\,\,\,\,\,\,\,\,\,\,\,\,\,\,\,\,\,\,\,\,\,\, = 22\% \cr & \text{Shopping →} \left(\frac{68.4}{360}\times100\right)\% \cr & \,\,\,\,\,\,\,\,\,\,\,\,\,\,\,\,\,\,\,\,\,\,\,\,\,\,\,\, = 19\% \cr & \text{Groceries →} \left(\frac{82.8}{360}\times100\right)\% \cr & \,\,\,\,\,\,\,\,\,\,\,\,\,\,\,\,\,\,\,\,\,\,\,\,\,\,\,\,\, = 23\% \cr & \text{Medicines →} \left(\frac{39.6}{360}\times100\right)\% \cr & \,\,\,\,\,\,\,\,\,\,\,\,\,\,\,\,\,\,\,\,\,\,\,\,\,\,\,\,\,\, = 11\% \cr & \text{Entertainment →} \left(\frac{36} {360}\times100\right)\% \cr & \,\,\,\,\,\,\,\,\,\,\,\,\,\,\,\,\,\,\,\,\,\,\,\,\,\,\,\,\,\,\,\,\,\,\,\,\,\,\,\,\,\,\, = 10\% \cr} $$
Amount spent on Groceries, Entertainment and Investments
$$\eqalign{ & = 45800\times\frac{23+10+15}{100} \cr & = 45800\times\frac{48}{100} \cr & \text{Amount spent on Commuting} \cr & = 45800\times\frac{22}{100} \cr & \text{Required %} \cr & = \left(\frac{45800\times\frac{48}{100}}{45800\times\frac{22}{100}}\times100\right)\% \cr & = \frac{2400}{11}\% \cr & = 218.18\% \cr & \approx 218\% \cr} $$

Join the Discussion
Login to post a comment or share your explanation.
Login