
?
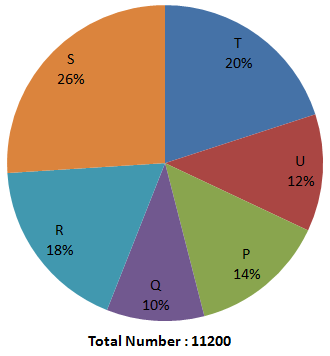
The total number of cellular phones (both Nokia and Samsung) sold by store Q increased by 15% from October to November and the same of cellular phones sold by store T increased by 5% from October to November. What was the total number of cellular phones sold by store Q and T together in November?
Answer & Solution
Correct Answer:
Option
C
| Store | Nokia Cellular Phones | Samsung Cellular Phones | Total Number of Cellular Phones |
| P | 896 | 672 | 1568 |
| Q | 840 | 280 | 1120 |
| R | 1120 | 896 | 2016 |
| S | 1568 | 1344 | 2912 |
| T | 448 | 1792 | 2240 |
| U | 704 | 640 | 1344 |
Number of cellular phones (both Nokia and Samsung) sold by store Q in October
= 11200 × $$\frac{10}{100}$$
= 1120
∵ Number of cellular phones (both Nokia and Samsung) sold by store Q in November
= 1120 × $$\frac{115}{100}$$
= 1288
Number of cellular phones (both Nokia and Samsung) sold by store T in October
= 11200 × $$\frac{20}{100}$$
= 2240
∵ Number of cellular phones (both Nokia and Samsung) sold by store T in November
= 2240 × $$\frac{105}{100}$$
= 2352
∵ Total number of cellular phones (both Nokia and Samsung) sold by Q and T together in November
= 1288 + 2352
= 3640

Join the Discussion
Login to post a comment or share your explanation.
Login