
ExamVeda
Login
Home
This question belongs to Data Interpretation Line Chart
Read the following information
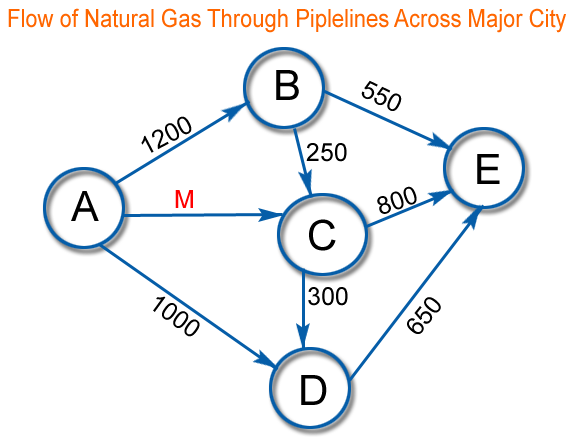
Directions (1 - 4): The following figure represents flow of natural gas through pipeline between major cities A, B, C, D and E (in suitable unit). Assume that supply equals demand. Refer to it and answer the following questions.-
Line Chart direction image
Line Chart
?

What is number of units demanded in B?

Answer & Solution
Correct Answer: Option B
The input into B is 1200 units and the output from B is (250 + 550) = 800 units.
Hence,
Demand = 1200 - 800 = 400 Units.
Examveda
Question posted by Examveda
Community

Join the Discussion

No comments yet Be the first to discuss this question.