
?
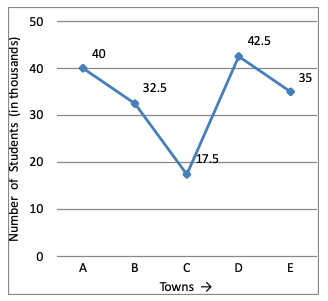
What is the average number of students appearing for the Aptitude Test from all the towns together?
Answer & Solution
Correct Answer:
Option
A
Average number of students appearing in Aptitude Test from all towns
$$ = \frac{\left(40+32.5+17.5+42.5+35\right)\times1000}{5}$$
$$\eqalign{ & = \frac{167.5\times1000}{5} \cr & = 33.5\times1000 \cr & = 33500 \cr} $$
$$ = \frac{\left(40+32.5+17.5+42.5+35\right)\times1000}{5}$$
$$\eqalign{ & = \frac{167.5\times1000}{5} \cr & = 33.5\times1000 \cr & = 33500 \cr} $$

Join the Discussion
Login to post a comment or share your explanation.
Login