
ExamVeda
Login
Home
This question belongs to Data Interpretation Line Chart
Read the following information
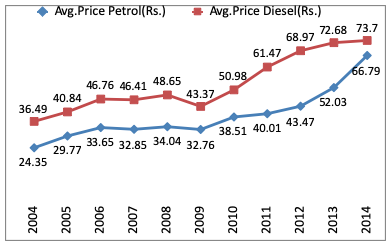
Direction (1 - 3): Observe the graph below and answer the following questions.
Direction image of Line Chart chapter
Line Chart
?

What is the average of diesel prices over the years 2006 - 2012?

Answer & Solution
Correct Answer: Option A
$$\frac{33.65+32.85+34.04+32.76+38.51+40.01+43.47}{7}$$
$$\eqalign{ & = \frac{255.29}{7} \cr & = 36.47 \cr}$$
Examveda
Question posted by Examveda
Community

Join the Discussion

2 Comments
Priyanka Jena
Priyanka Jena 8 months ago
Wrong answer......ask for diesel not petrol
Arushi Shandilya
Arushi Shandilya 4 years ago
the given solution to the question is given wrong as we need to calculate the diesel prices not petrol prices but in solution they solved petrol prices which is wrong.