
?
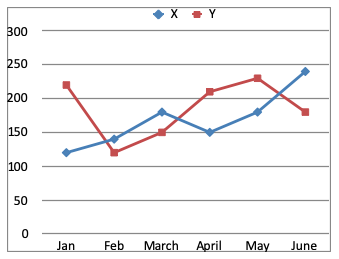
What is the difference between the total number of watches sold in both the towns together in June and the total number of watches sold in both the towns together in March?
Answer & Solution
Correct Answer:
Option
B
Total number of watches sold in both the towns together in the month of June
= 240 + 180
= 420
Total number of watches sold in both the towns together in March
= 180 + 150
= 330
Required difference
= 420 - 330
= 90
= 240 + 180
= 420
Total number of watches sold in both the towns together in March
= 180 + 150
= 330
Required difference
= 420 - 330
= 90

Join the Discussion
Login to post a comment or share your explanation.
Login